See Which Marketplace Actually Makes You Money
Open Analytics and the Overview tab shows how much each marketplace and store sold, so you can see which one sells the most. These are sales figures; payout and profit are on Financials. Shopee, Lazada, TikTok Shop and Shopify sit side by side. Start on the Overview tab and check Revenue by Store. Set one date range and one set of filters, and they apply to every tab. Product Performance ranks your products by sales, orders, or units. Product Analysis shows one product in detail.
Applies to: All plans. Product Performance and Product Analysis need a paid plan; see the table below.
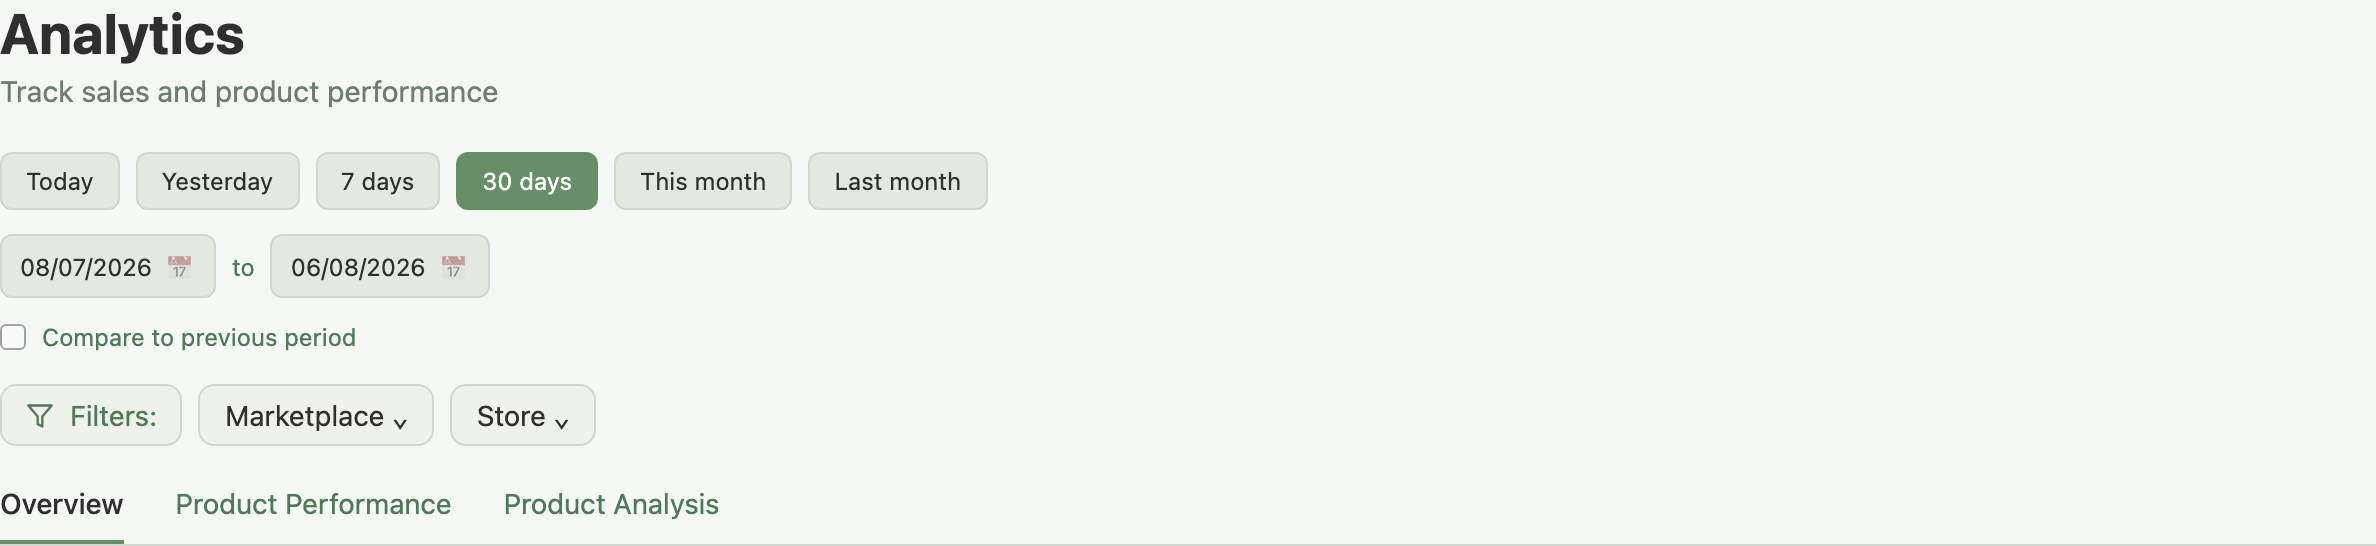
The three tabs
- Overview: the dashboard for the whole business. KPI cards, revenue and order trends, and a catalog snapshot.
- Product Performance: a sortable table of every product and SKU. The operational view for spotting your best and worst sellers.
- Product Analysis: a deep dive on a single product across stores. Use this after you've found something in Product Performance and want to understand why.
Payouts, fees and profit are not one of these three tabs. They live on a separate page, Financials, reachable from the main sidebar next to Analytics. See Your Financials Page.
On Free, those two tabs show a lock icon, and clicking one prompts an upgrade instead of opening it.
Marketplace and store filters
The Filters: bar narrows what every tab shows:
- Marketplace: pick one or more (Shopee, Lazada, TikTok Shop, Shopify).
- Store: pick specific stores, from any marketplace, regardless of your Marketplace selection. This filter appears once you have two or more stores on the same marketplace.
- Clear Filters: resets both back to "all".
Marketplace and Store compose as an intersection, not a cascade. Picking a marketplace does not narrow the Store list to that marketplace, and both filters apply together: if they don't overlap, you get zero results.
Example: you pick Shopee in the Marketplace filter, then pick a Lazada store in the Store filter. No orders match both, so every KPI on the page reads zero. Clear one of the two filters to fix it.
Choosing a Date Range
The date range picker sits above the filters bar. Quick ranges are Today, Yesterday, 7 days, 30 days (default), This month and Last month. You can also pick a custom range of up to 6 months, ending as late as today.
- 7 days and 30 days include today, so 7 days is today plus the six days before it.
- Today is still in progress, so the last bar on a trend chart is normally shorter. That's the day being unfinished, not a drop in sales. Today also never has a settled payout; see Understanding Revenue and Seller Payout.
- Ranges run on your browser's local time, not your account's timezone. There's no separate timezone setting for Analytics.
Example: your account timezone is set to Singapore, but you're checking Analytics from a browser set to US Pacific time. "Yesterday" on this page means yesterday in Pacific time, so it can disagree with Singapore by a day's worth of orders near midnight.
Currency does come from your account setting (see Managing Your Account). When your stores report in different currencies, Revenue Trend and Revenue by Store convert them to your main currency at a stored reference rate, with a note under the chart. The rate is not the one on each sale day, so converted figures won't match your bank records exactly. A store with no stored rate is left out and named after Not shown: (Revenue Trend) or Not in the total: (Revenue by Store). Your Financials Page explains more.
Comparing to a previous period
Tick Compare to previous period to see how the current range stacks up against the immediately preceding range of the same length. KPI cards show a delta line below each value:
- Magnitudes (revenue, orders, units, payout) show a percentage change.
- Rates (return rate, cancellation rate) show a percentage-point change, avoiding a misleading "100% growth" when the base is small.
Comparison is available only for date ranges of 3 months or less; a longer range disables the toggle.
Example: you select 30 days and tick Compare to previous period. The page compares the past 30 days against the 30 days before that. Your Product GMV card shows S$48,140.54 with a green "12%" delta, and your Return Rate card shows 1.2% with its own point-difference delta.
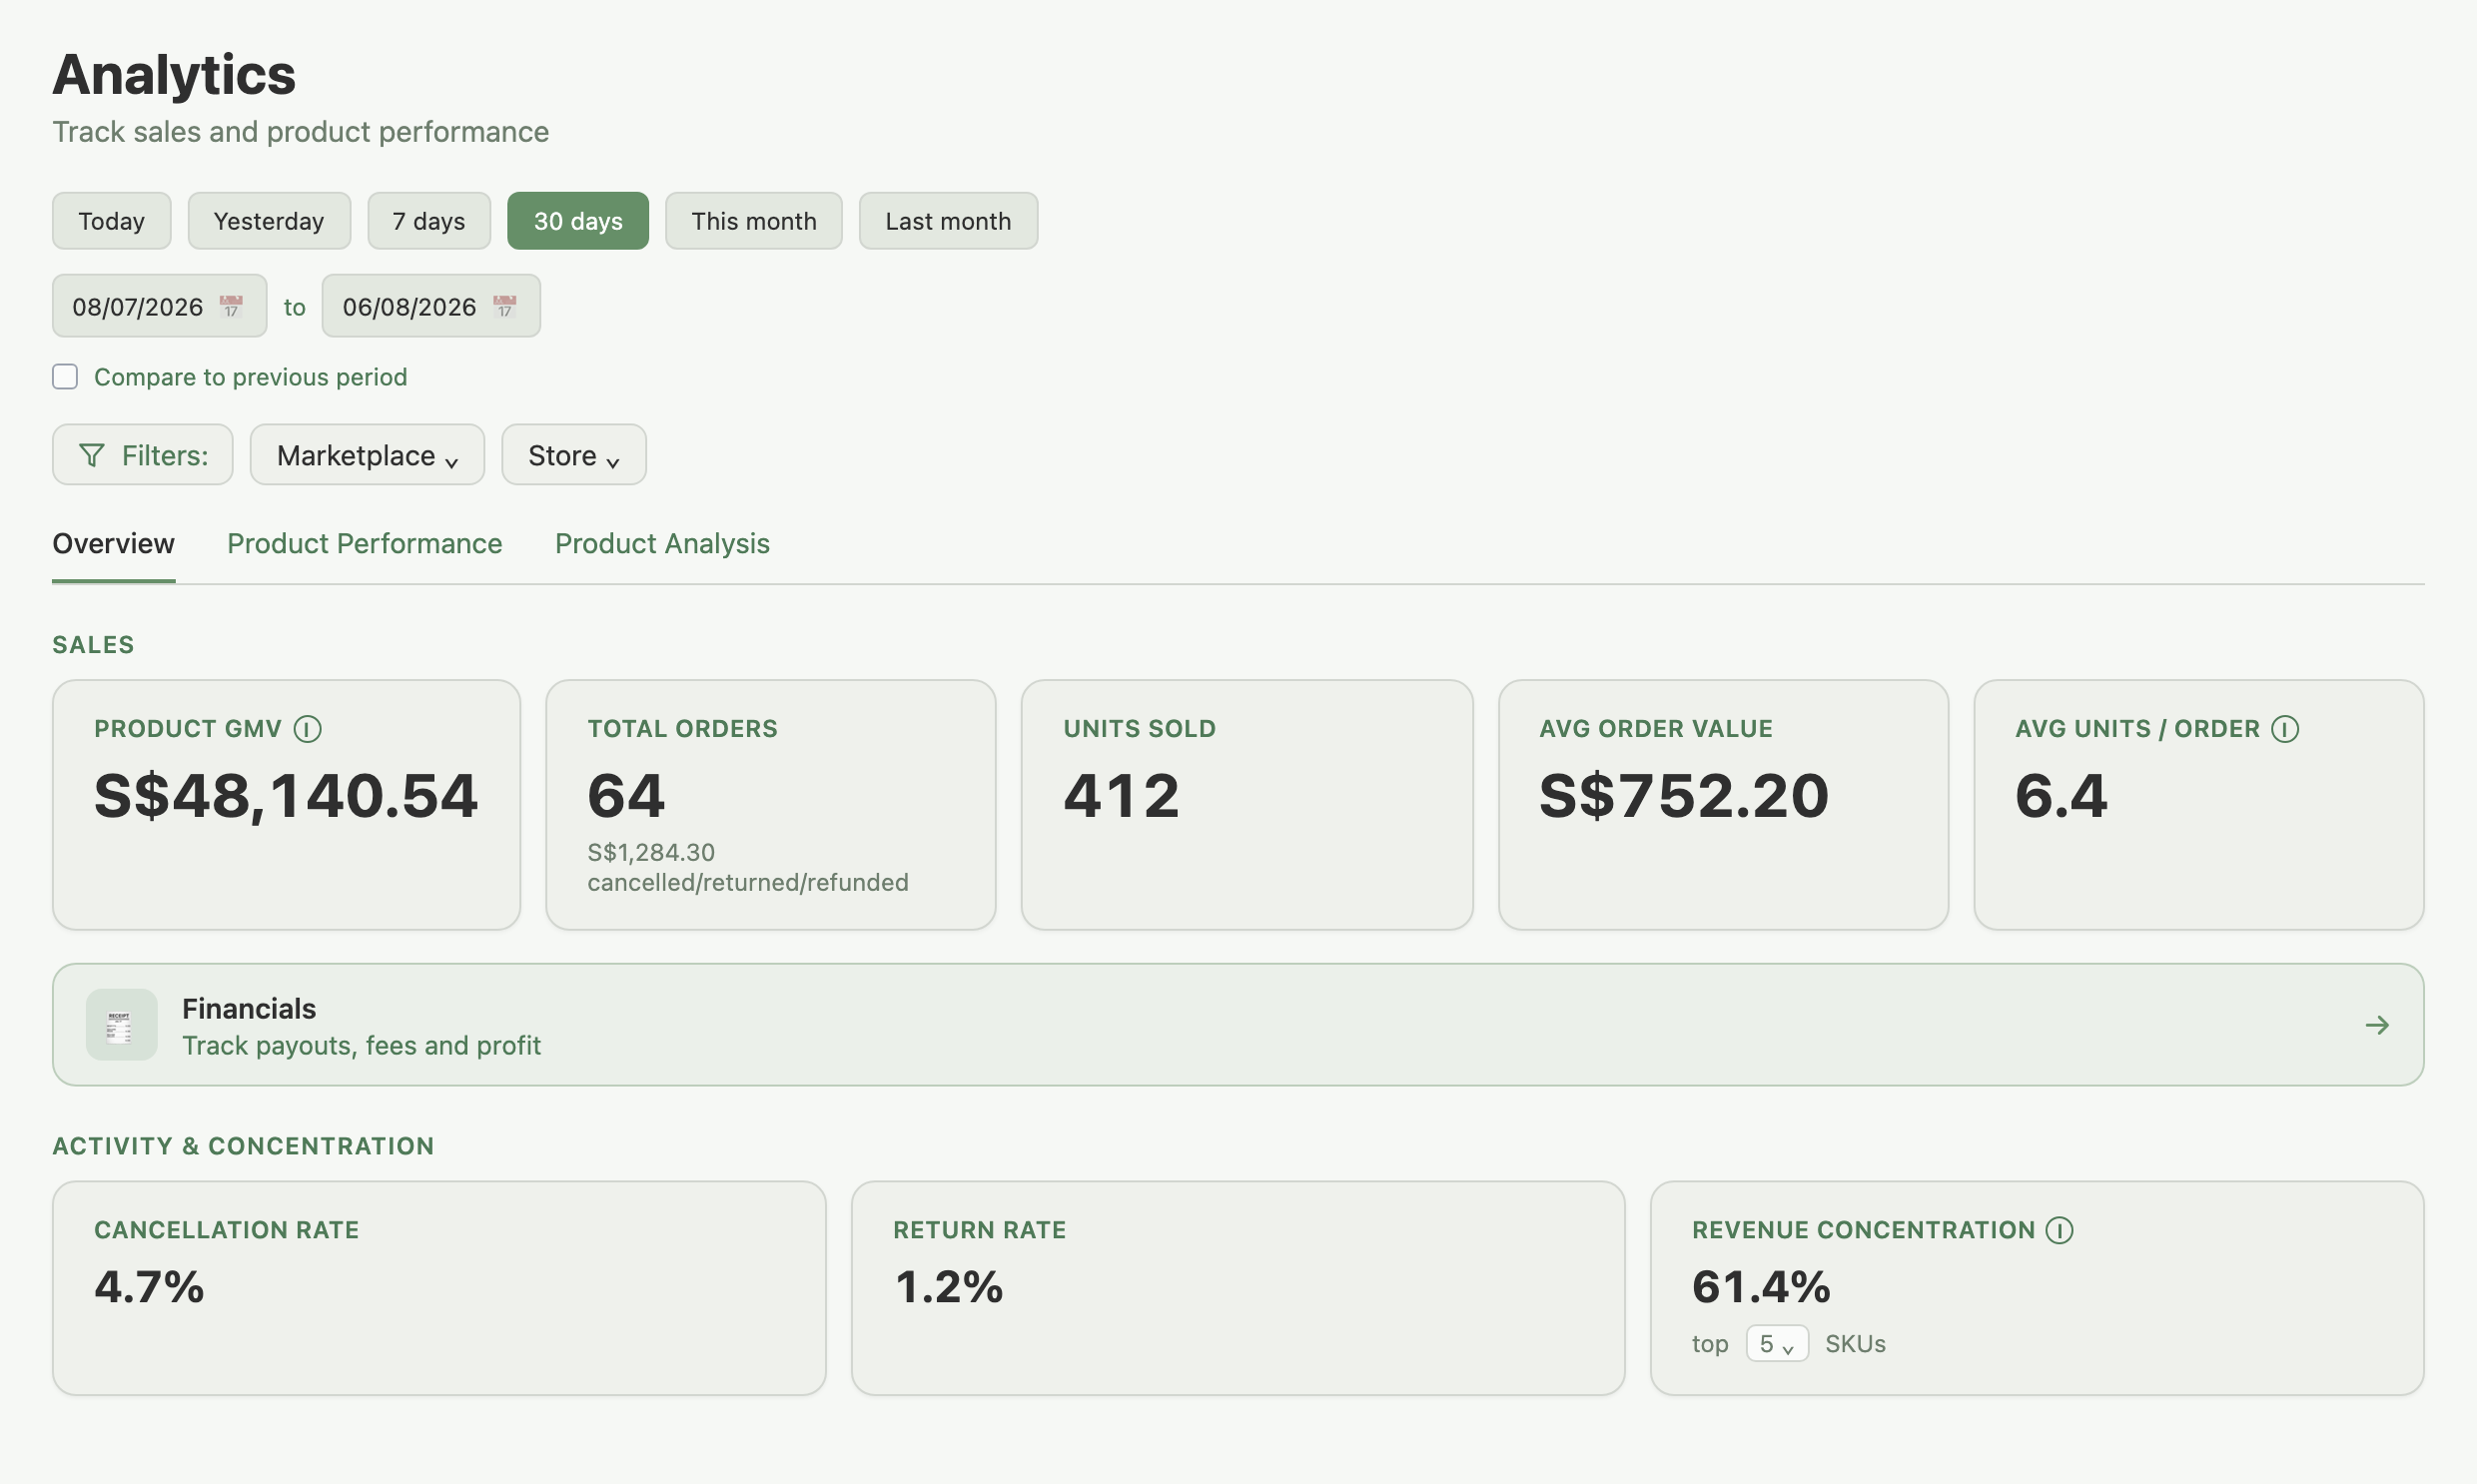
The Overview tab, top to bottom
- Sales: Product GMV, Total Orders, Units Sold (items, as opposed to orders), Avg Order Value, Avg Units / Order. Always visible.
- Financials card: a cross-link, not a KPI block, pointing to the Financials page where Seller Payout, Total Fees, Effective Margin, Effective Fee Rate, Avg Payout / Order and the full Profit and Loss statement live.
- Activity & Concentration: Cancellation Rate, Return Rate, and a Revenue Concentration card showing what share of revenue your top SKUs contribute (you choose how many SKUs count as "top").
For full definitions of every KPI, especially the difference between Product GMV and Seller Payout, see Understanding Revenue and Seller Payout.
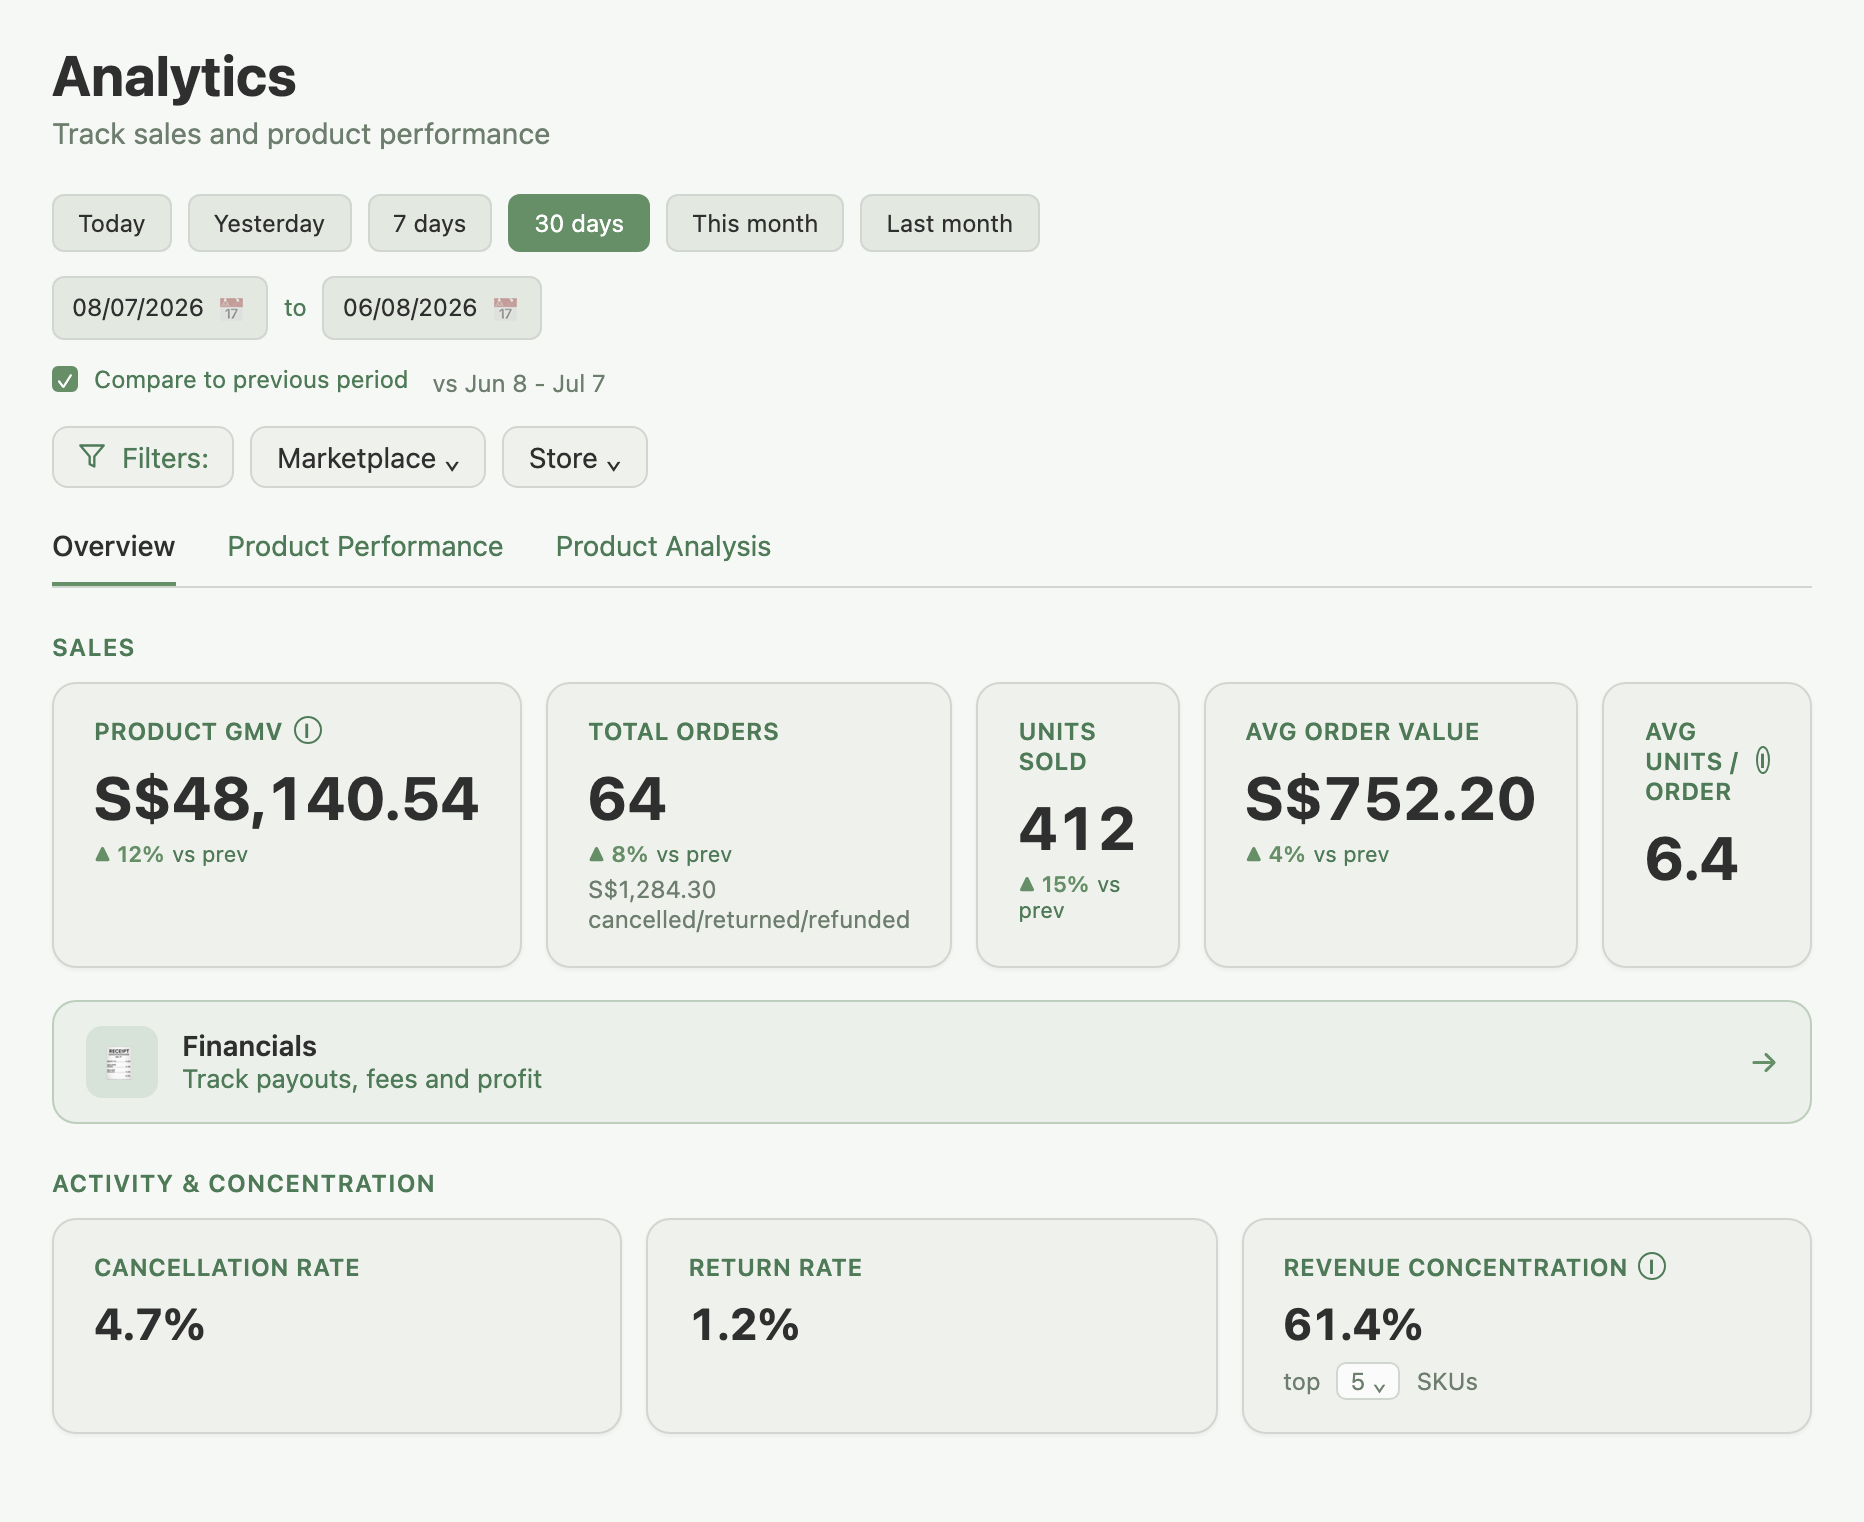
Revenue and orders trends, and your by-store breakdown
Below Activity & Concentration, two chart rows show the same numbers over time and by store:
- Revenue Trend and Orders Trend, each with a Daily/Monthly toggle. Monthly shows the current month to date plus the previous 5, widened if your range reaches further back, so the current month's bar can be partial.
- Revenue by Store and Orders by Store sit beside each chart, breaking the same total down per store so you can see which marketplace is carrying the number.
With more than one store, each trend chart stacks your stores in colour:
- Each store has its own colour, the same on every page.
- Click a store in the legend (desktop) or tap its row under the chart (phone) to hide or show it.
- With more than six stores, you see the top 5 by sales (or orders) plus a Show all button.
The by-store cards list your top 5 stores (more if the card has room beside the chart), then one Other stores row that adds up the rest. Same-named stores on one marketplace show a number, such as "Name (1)". Each row shows the store's amount in its own currency, while the order, share bars, percentages and card total use your main currency.
Together they answer "which marketplace actually makes me money?": scan the by-store cards for the split, then use the trend chart beside them to see whether that split is growing or shrinking over time.
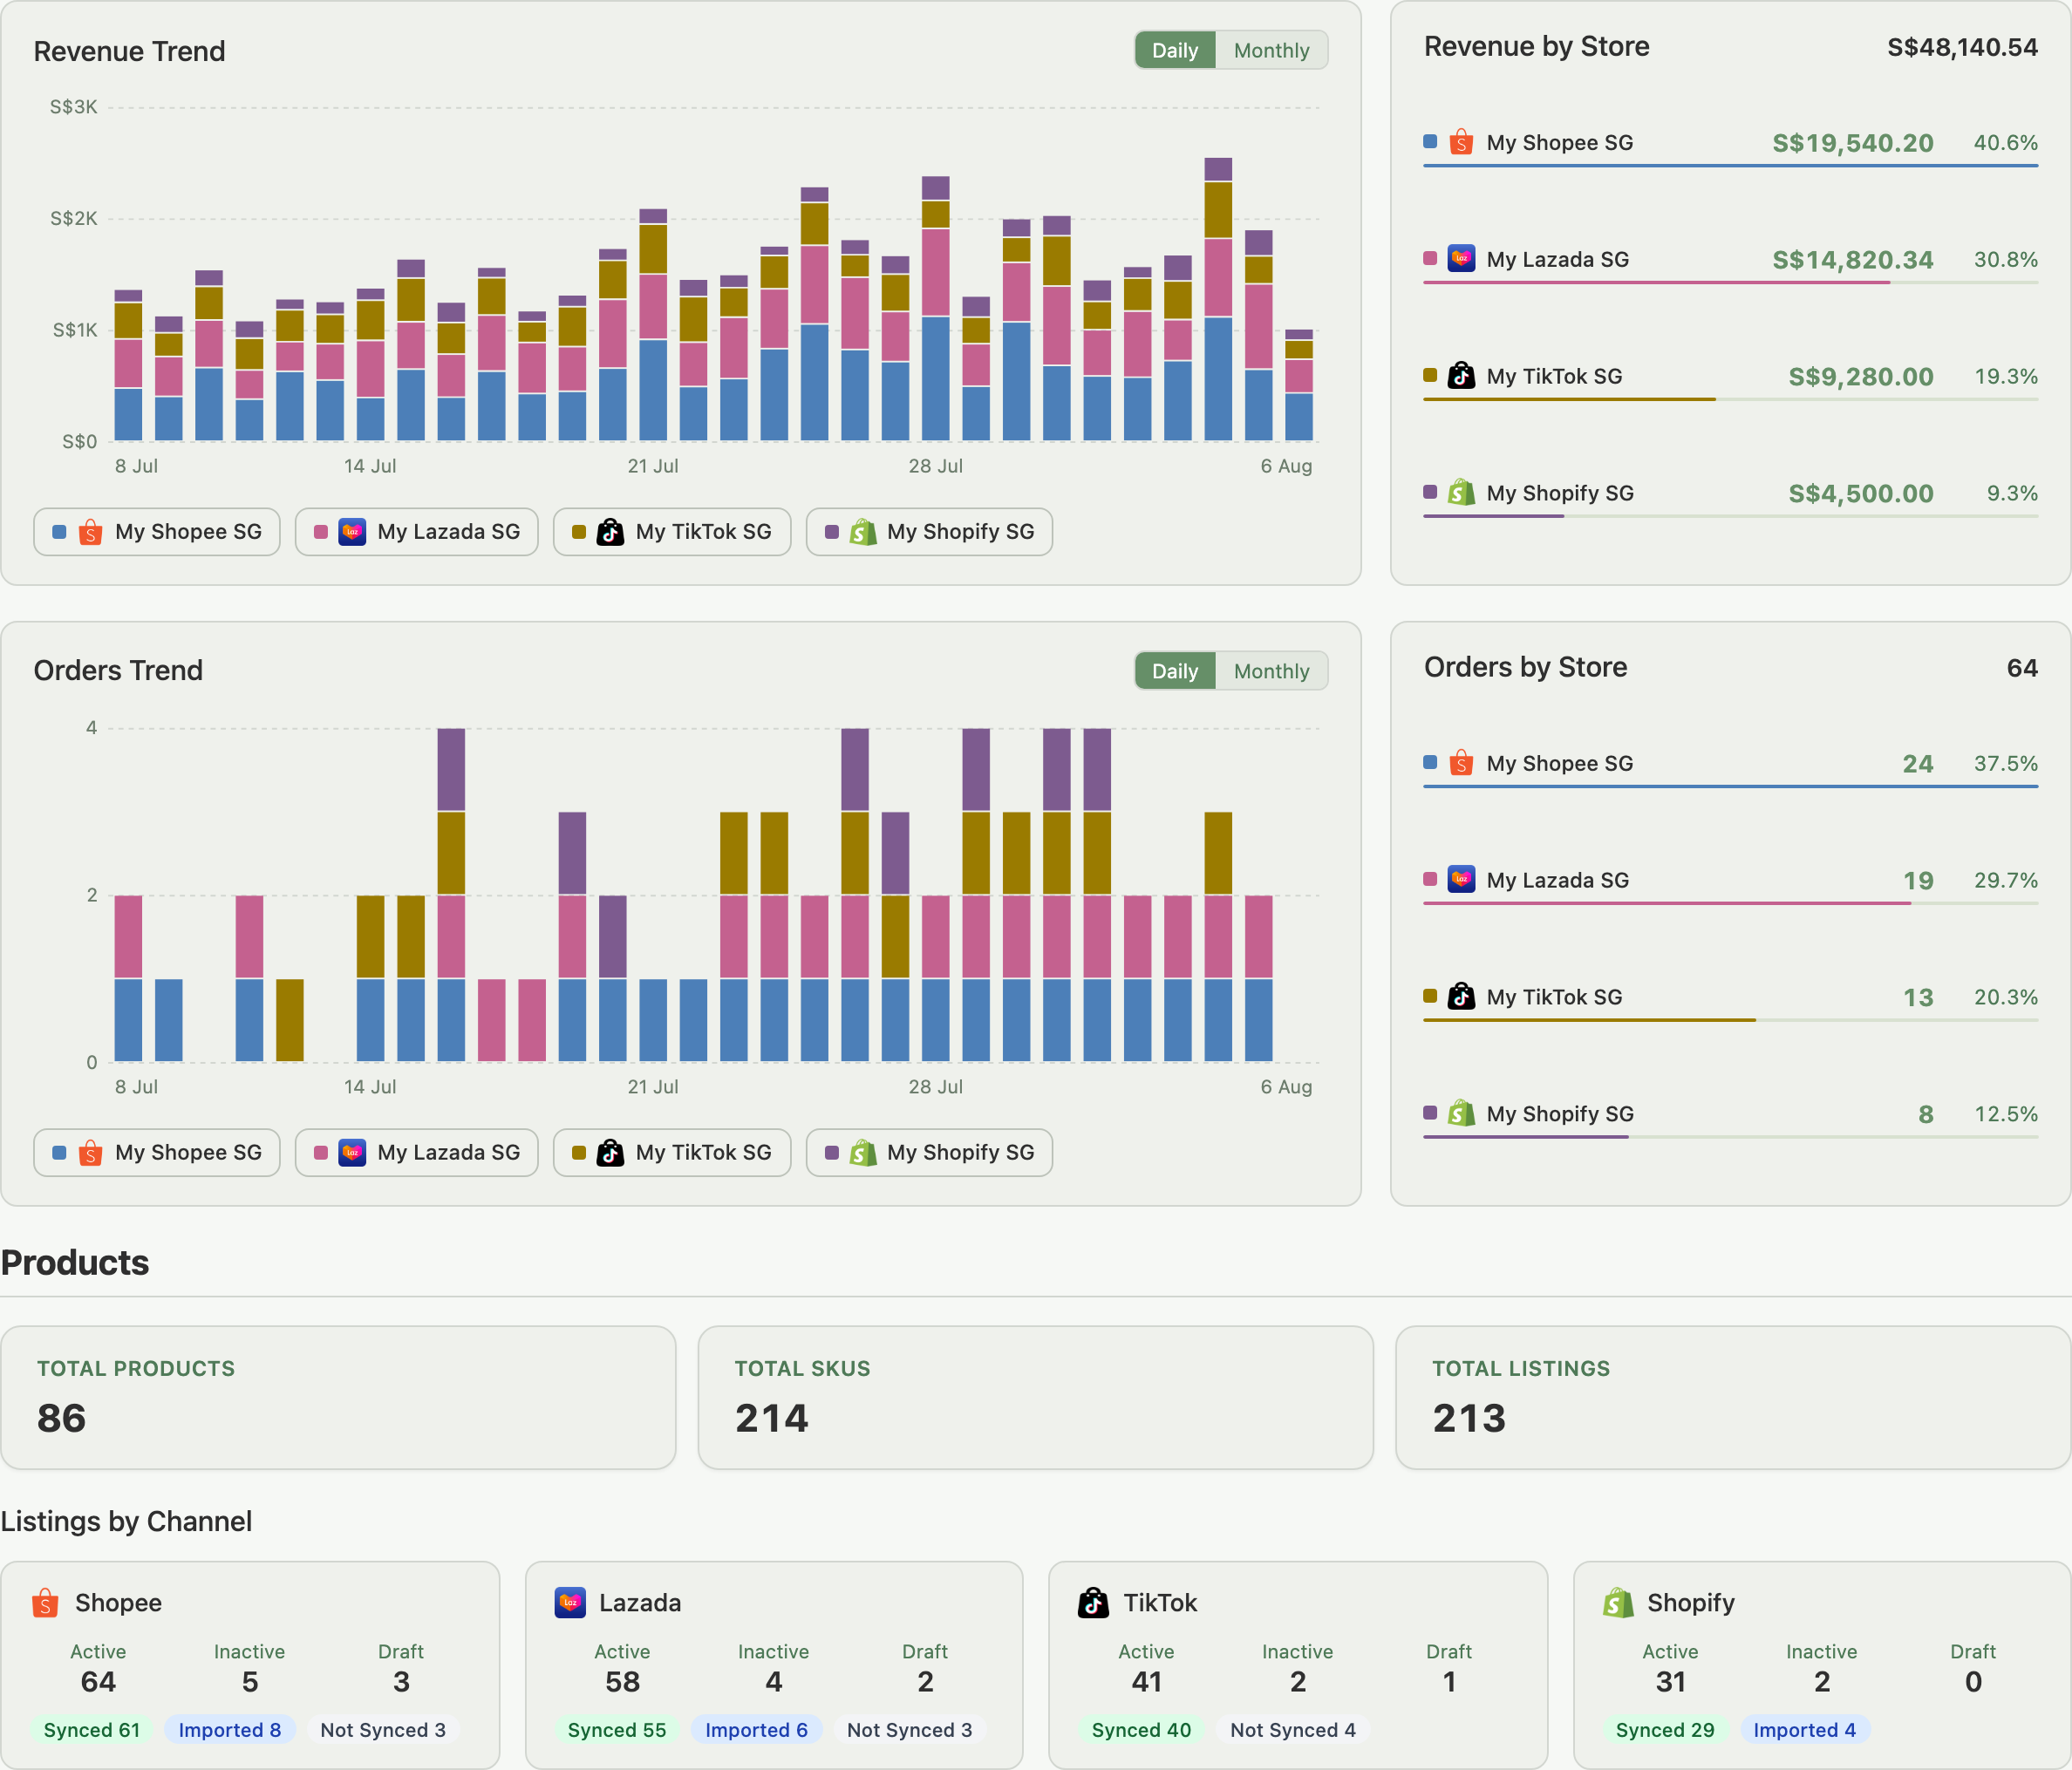
Your product catalog and Listings by Channel
Under a Products heading, three catalog cards show current counts, not sales figures: Total Products, Total SKUs, Total Listings.
Below them, Listings by Channel shows one card per marketplace (Shopee, Lazada, TikTok, Shopify), whether or not you've connected that channel. Each card shows:
- Status counts: Active, Inactive, Draft.
- Sync badges: Synced, Imported, Not Synced, or Error, for whichever statuses have listings in them.
A channel you haven't connected shows 0 for every status and no sync badges. That's normal, not an error.
Which orders Analytics counts
Every tab counts orders by the date they were placed, with no Count by control, so a date range here always means "orders placed in this window".
- Payout-based figures on Product Performance and Product Analysis (Net Payout, Net Profit, margin) cover only orders already paid out, so a recent period can understate them. A line above each section says how many have been paid out.
- Financials won't match, because it counts money by the date it landed. Neither is wrong, and both pages carry a note explaining the difference.
Troubleshooting
The Store filter returned zero results after picking a marketplace. Marketplace and Store filters intersect instead of cascading.
- If the store you picked belongs to a different marketplace than the one selected, nothing matches.
- Clear one of the two filters, or pick a store that belongs to the selected marketplace.
"30 days" looks like it's cutting off at the wrong day. Analytics date ranges run on your browser's local clock, not your account's configured timezone.
- If your device's timezone differs from your account's, the boundary can land a day earlier or later than you expect.
- The Dashboard uses your account timezone, so its "today" and Analytics' "today" can disagree. Compare like ranges from the same page.
FAQ
Why don't my Analytics numbers match my Financials numbers?
They count money differently on purpose. Analytics always counts by the date an order was placed; Financials counts by the date money landed (or by order date, if you switch its Count by toggle). Read the on-screen note on either page rather than trying to divide one figure into the other.
Can I compare more than 3 months of data?
Not with the Compare to previous period toggle; it's disabled for date ranges longer than 3 months. Pick a shorter range, or compare two custom ranges manually by switching between them.
Why are Product Performance and Product Analysis locked?
Those two tabs need a paid plan (Lite or above). The Overview tab is available on every plan, including Free.
Related Articles
- Your Financials Page
- Understanding Revenue and Seller Payout
- Product Performance Tab
- Product Analysis Tab
- Set Your Cost Prices
- Managing Your Account
Need More Help?
Visit our Feedback page, WhatsApp us, or email hello@indexync.com with your account details and any questions about Analytics.