See Your Best and Worst Performing Products
The Product Performance tab lists every product (or every SKU) as a sortable, searchable table: sales, payout, margin, and stock health side by side. Sort it to find your best sellers, your worst returns, or stock that hasn't moved in months. Export it to CSV when you need a file.
Applies to: Lite and up. On Free you'll see an upgrade option instead of this tab; see How to Upgrade Your Plan. CSV export is included on every plan that can open this tab.
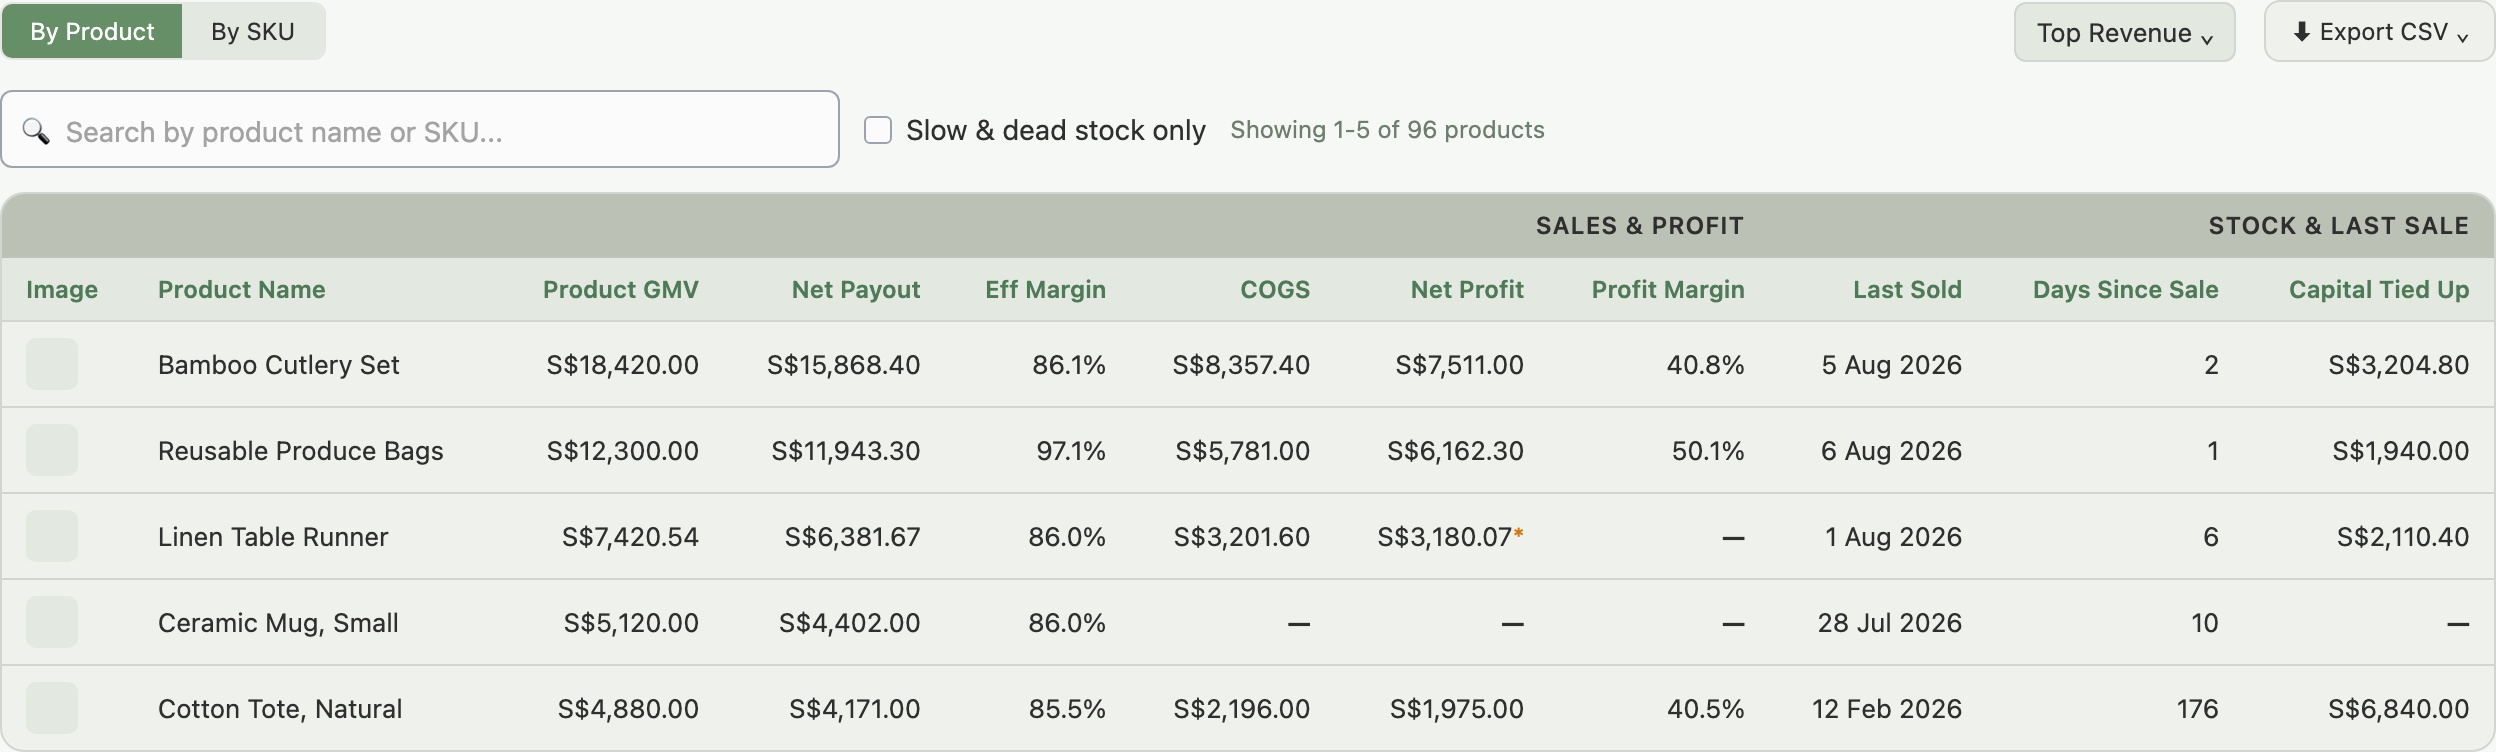
Product view or SKU view: which do I use?
Toggle between By Product and By SKU at the top of the table.
- By Product groups all SKUs of a product into one row. Use this for a top-line view of how each product is doing.
- By SKU shows each variation as its own row, with Seller SKU and Combination in the sticky left columns. Use this to compare variants: sizes, colours, or marketplace-specific SKUs.
What do the columns show?
The table has two column groups, plus the sticky product columns on the left:
- Product image and Product Name. In SKU view, also Seller SKU and Combination.
- Sales & profit: Product GMV, Net Payout, Eff Margin, COGS, Net Profit, Profit Margin, Units Sold, Orders, Avg Price, Return Rate, Cancel Rate, Rev Share.
- Stock & last sale: Last Sold, Days Since Sale, and Capital Tied Up, always visible.
Notes on the profit columns:
- Cost prices. COGS, Net Profit and Profit Margin show a dash when any sale behind the cell has no recorded cost. Unlike Financials, they never fall back to a profit "Before cost of goods". See Set Your Cost Prices.
- TikTok rows. Net Profit falls back to Gross Profit, marked with an asterisk, because TikTok reports payout at shop level. Profit Margin shows a dash.
- Formulas. See Why Your Payout Doesn't Match Your Revenue.
On the last page of results, you may see an Unattributed row. It carries sales that couldn't be tied to one product: the listing was later deleted or relisted, the order predates Indexync tracking internal SKUs, or the order had no net item revenue to split, for example a fully discounted order. These amounts are real and already counted in your totals; without this row, the product rows would add up to less than expected.
Per-store columns don't appear on screen. A breakdown by individual store is available only in the CSV export, described below.
How do I find slow-moving or dead stock?
Tick Slow & dead stock only, next to the search box, to switch the table to a narrower view built for spotting capital sitting idle:
- Choose your window. A "no sales in N days" selector appears once ticked: 30, 60, 90, or 180 days.
- Capital tied up appears as a headline card above the table: the total value of stock behind the rows in this view, based on units on hand times cost price. If some rows have no cost price set, the card tells you how many and links to fix it, so the total is never silently understated.
- Columns reorder to lead with Last Sold, Days Since Sale, and Capital Tied Up; sales and profit columns still follow.
- If nothing matches your window, the table says so and suggests shortening it.
Example: you tick the box with a 90-day window and find a product with S$3,200 in stock that hasn't sold in over six months. You didn't know that much capital was sitting idle until the headline card totalled it for you.
Which orders does the table count?
A line above the table states which orders the figures cover.
- Order date. Every column counts orders by the date they were placed. There is no Count by control.
- Paid-out orders only for Net Payout, Net Profit and the margin columns, so a recent range can understate them. The same line says how many rows have paid-out orders.
- COGS is the exception: it covers every order in the range, settled or not. So Net Payout minus COGS does not equal Net Profit, which uses the cost of paid-out orders only. Both tooltips say so.
- Financials won't match, because it counts money by the date it landed. The note above the table links to it.
How do I sort the table?
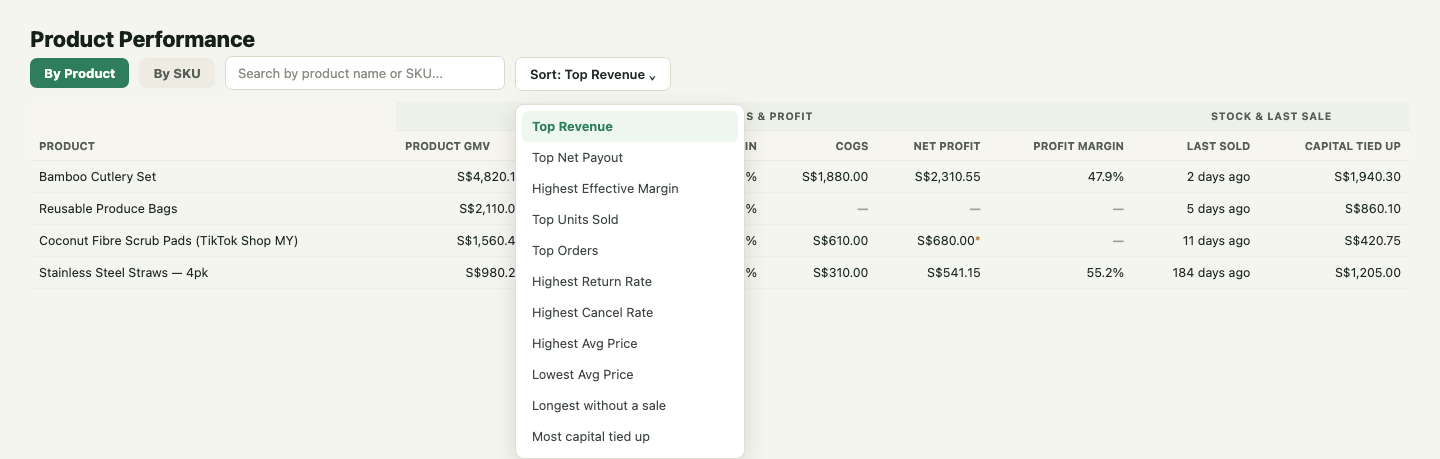
Use the Sort dropdown for common views:
- Top Revenue: best sellers first.
- Top Net Payout: what's actually earning you the most.
- Highest Effective Margin: your most profitable products.
- Top Units Sold: highest volume products.
- Top Orders: most order count.
- Highest Return Rate: products with quality or fit issues.
- Highest Cancel Rate: products buyers regret.
- Highest Avg Price / Lowest Avg Price: price range scan.
- Longest without a sale: slowest-moving SKUs, oldest first.
- Most capital tied up: SKUs holding the most stock value.
You can also click any column header to toggle that column's sort direction.
Example: you sort by Highest Return Rate and the first row is a T-shirt at 22% returns versus your 4% average. Click into it; Product Analysis shows the issue is concentrated on one SKU (size S) across both Shopee and Lazada. You check the size chart and fix the listing.
How do I search the table?
The search box filters as you type, matching partial text in any case.
- Product view matches product name only.
- SKU view also matches Seller SKU, but not the Combination text, so "Red, L" won't find a variant. Search by product name or Seller SKU instead.
- Rows per page defaults to 25; switch to 50 or 100 from the dropdown at the bottom.
What does "Compare to previous period" change?
Tick Compare to previous period in the page header and every metric cell shows a change against the previous period. Amounts and counts show a percentage, and return and cancel rates show percentage points. See See Which Marketplace Actually Makes You Money for how the comparison range works.
How do I drill into one product?
Click any row to open the Product Analysis tab, pre-filtered to that product (or SKU). See See How a Single Product Performs Across Every Store.
What's in the CSV export?
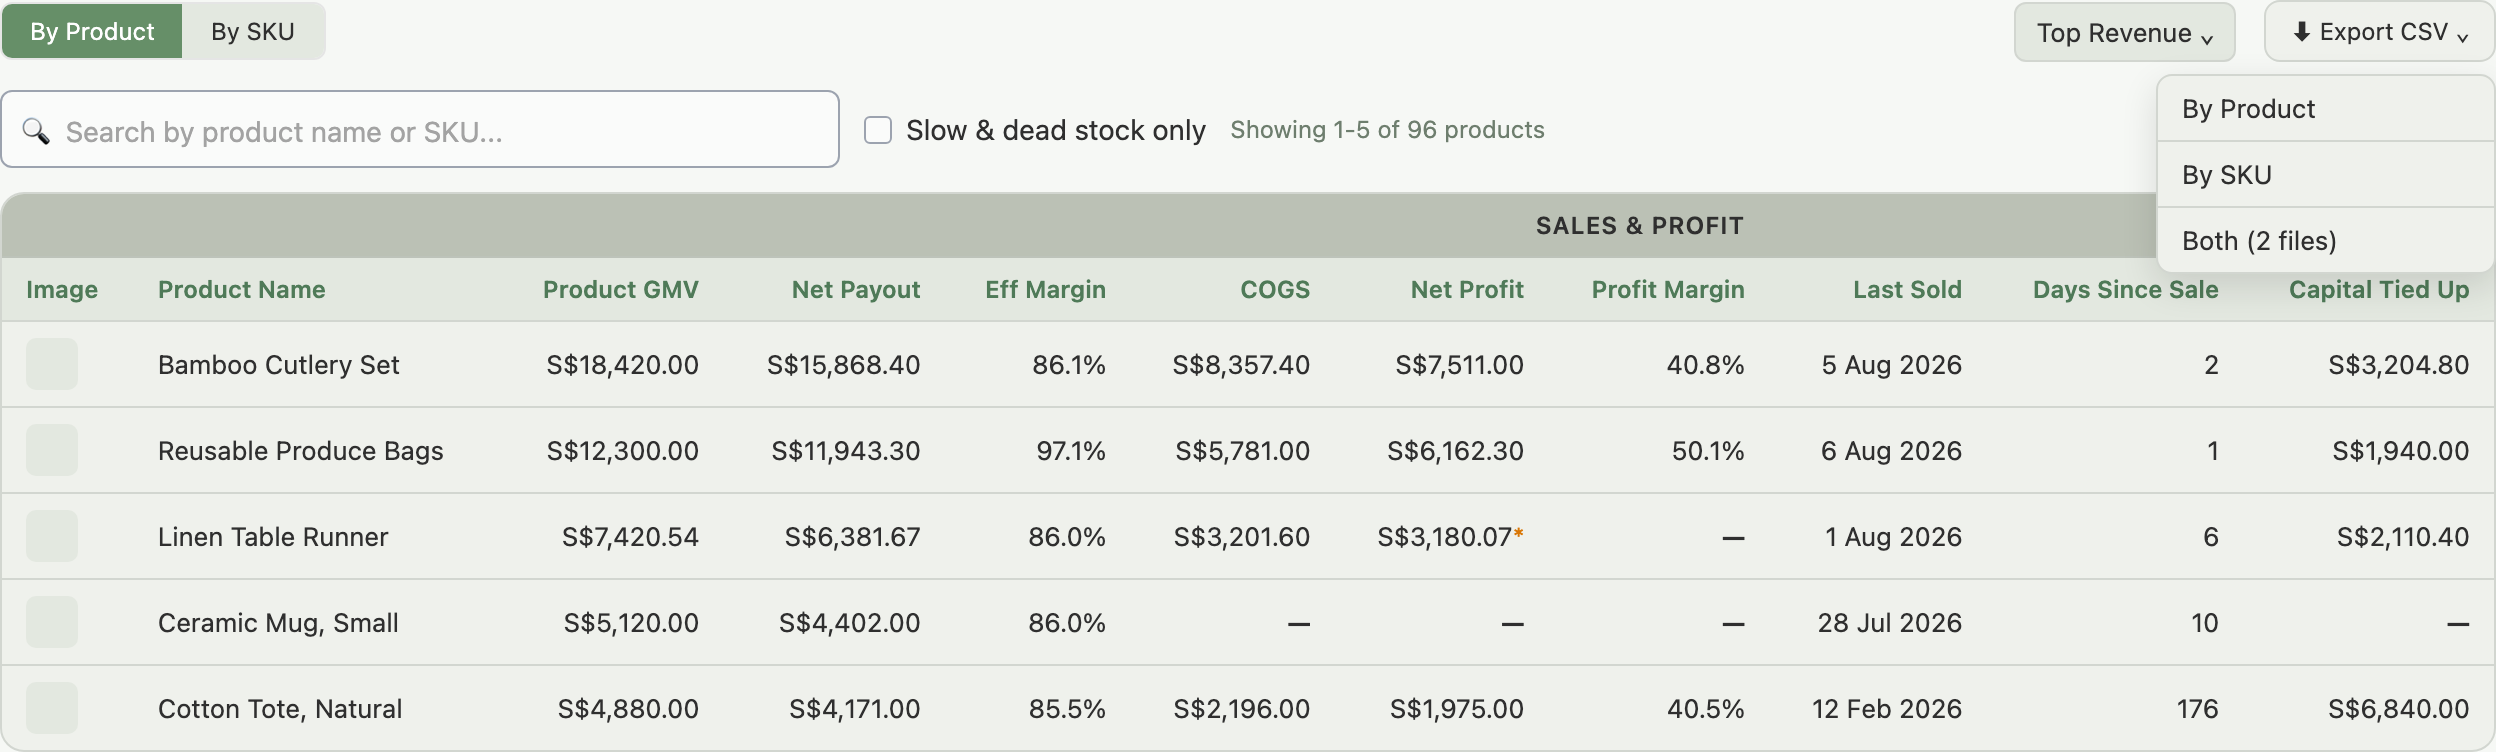
Click Export CSV in the page header to download the table data. The dropdown has three options:
- By Product: one row per product. File name:
indexync-analytics-performance-by-product-{start}-to-{end}.csv. - By SKU: one row per SKU, including Seller SKU and Combination. File name:
indexync-analytics-performance-by-sku-{start}-to-{end}.csv. - Both (2 files): downloads both at once.
Each file carries more than what's on screen:
- Every on-screen metric, plus Last Sold, Days Since Sale, and Capital Tied Up.
- Per-store columns for each connected store, headed with the store's full name and the metric, for example "Coffee Corner Product GMV". These appear only in the export. Same-named stores add the marketplace in brackets, such as "Asian Beauty X (Lazada)". On the same marketplace they add the country, such as "(Lazada SG)", or a store number when the country matches too, such as "(Lazada, store 1)".
- Total Fees, Effective Fee Rate, and Avg Payout / Order, which also don't appear on screen.
- Fees Exceed Revenue, marked "Yes" on any row whose fees for the period exceeded the revenue behind them: usually a refund, an adjustment, or an attribution issue worth a closer look.
- Profit Note, marking any row where Net Profit is really Gross Profit (the TikTok case above).
Notes on the file:
- Blank means unknown. COGS, Net Profit and Profit Margin are blank wherever the screen shows a dash. A blank cell means "we cannot state this", never zero.
- Currency. Blended columns are converted to your main currency, matching the page. Per-store columns stay in each store's own currency. A blended cell is left blank if a currency in it has no conversion rate, rather than silently dropping that store.
- Provenance. Below the data, each file states the date range, which orders are included and how currency was treated.
Troubleshooting
My product isn't in the table. It's outside the current date range, filtered out by your store or marketplace selection, or has zero orders in the period. Adjust filters and check the date range. If totals don't seem to add up, check the Unattributed row on the last page.
A column shows a dash.
- Most columns: the store's currency couldn't be converted to your main currency. See Managing Your Account.
- COGS, Net Profit or Profit Margin: some or all sales behind the cell have no recorded cost, or the cost has no conversion rate. See Set Your Cost Prices.
The delta lines aren't showing. The Compare to previous period toggle is off, or the selected date range exceeds 3 months (comparison is disabled beyond that).
FAQ
How do I find my best-selling products?
Sort by Top Revenue or Top Net Payout in the Sort dropdown. Top Revenue ranks by Product GMV; Top Net Payout ranks by what actually landed in your payout after fees.
How do I find stock that isn't selling?
Tick Slow & dead stock only, choose a no-sales window (30, 60, 90, or 180 days), and sort by Most capital tied up or Longest without a sale. The headline card totals the capital sitting in that stock.
Why can't I search by color or size?
The search box matches product name, and in SKU view, Seller SKU. It doesn't match the Combination column, so a search for "Red, L" won't find that variant. Search by product name or Seller SKU instead.
Why don't I see per-store columns on screen?
Per-store breakdowns exist only in the CSV export. On screen, blended columns like Product GMV already combine every store's figures into your main currency.
What's the difference between By Product and By SKU view?
By Product groups every SKU of a product into one row, for a top-line view. By SKU shows each variation separately, so you can compare sizes, colours, or marketplace-specific listings against each other.
Related Articles
- See Which Marketplace Actually Makes You Money
- Why Your Payout Doesn't Match Your Revenue
- Set Your Cost Prices
- See How a Single Product Performs Across Every Store
- Your Financials Page
- Managing Your Account
- How to Upgrade Your Plan
Need More Help?
Visit our Feedback page, WhatsApp us, or email hello@indexync.com with your account details and any questions about the Product Performance tab.